See on the Map What the Listing Leaves Out
Turn on the risk overlays and see the insights behind a home's surroundings
4 min read
A listing shows you what it takes to sell a house. It does not show you what it takes to buy a home: the flood zone line two doors down, or the high-voltage corridor behind the back fence.
All of that lives on the OpenHomeVue map. Every home you save gets a pin, and around that pin you can switch on more than two dozen overlays, grouped by what they show: hazards, schools, and neighborhood context. This article covers the hazard group, the risks a listing never mentions, on the phone and on the web.
This article walks through turning on a risk overlay two ways, stacking the risks that matter to you, and measuring what you find.
Turn on a risk overlay, two ways
Jump straight from a Key Consideration card
Already spotted a flagged risk in Key Considerations? Tap the info card, and it takes you right to the map overlay.
- On a saved home, open the Key Considerations section and tap the flagged card, for example Flood.
- The map opens with that risk's overlay already on, focused and zoomed on the home.
The home's flagged risks also sit down the right edge of the map, one icon each. Tap an icon to turn that overlay on or off, and Clear all at the bottom to turn every overlay off. On the Web App, clicking the card does the same.
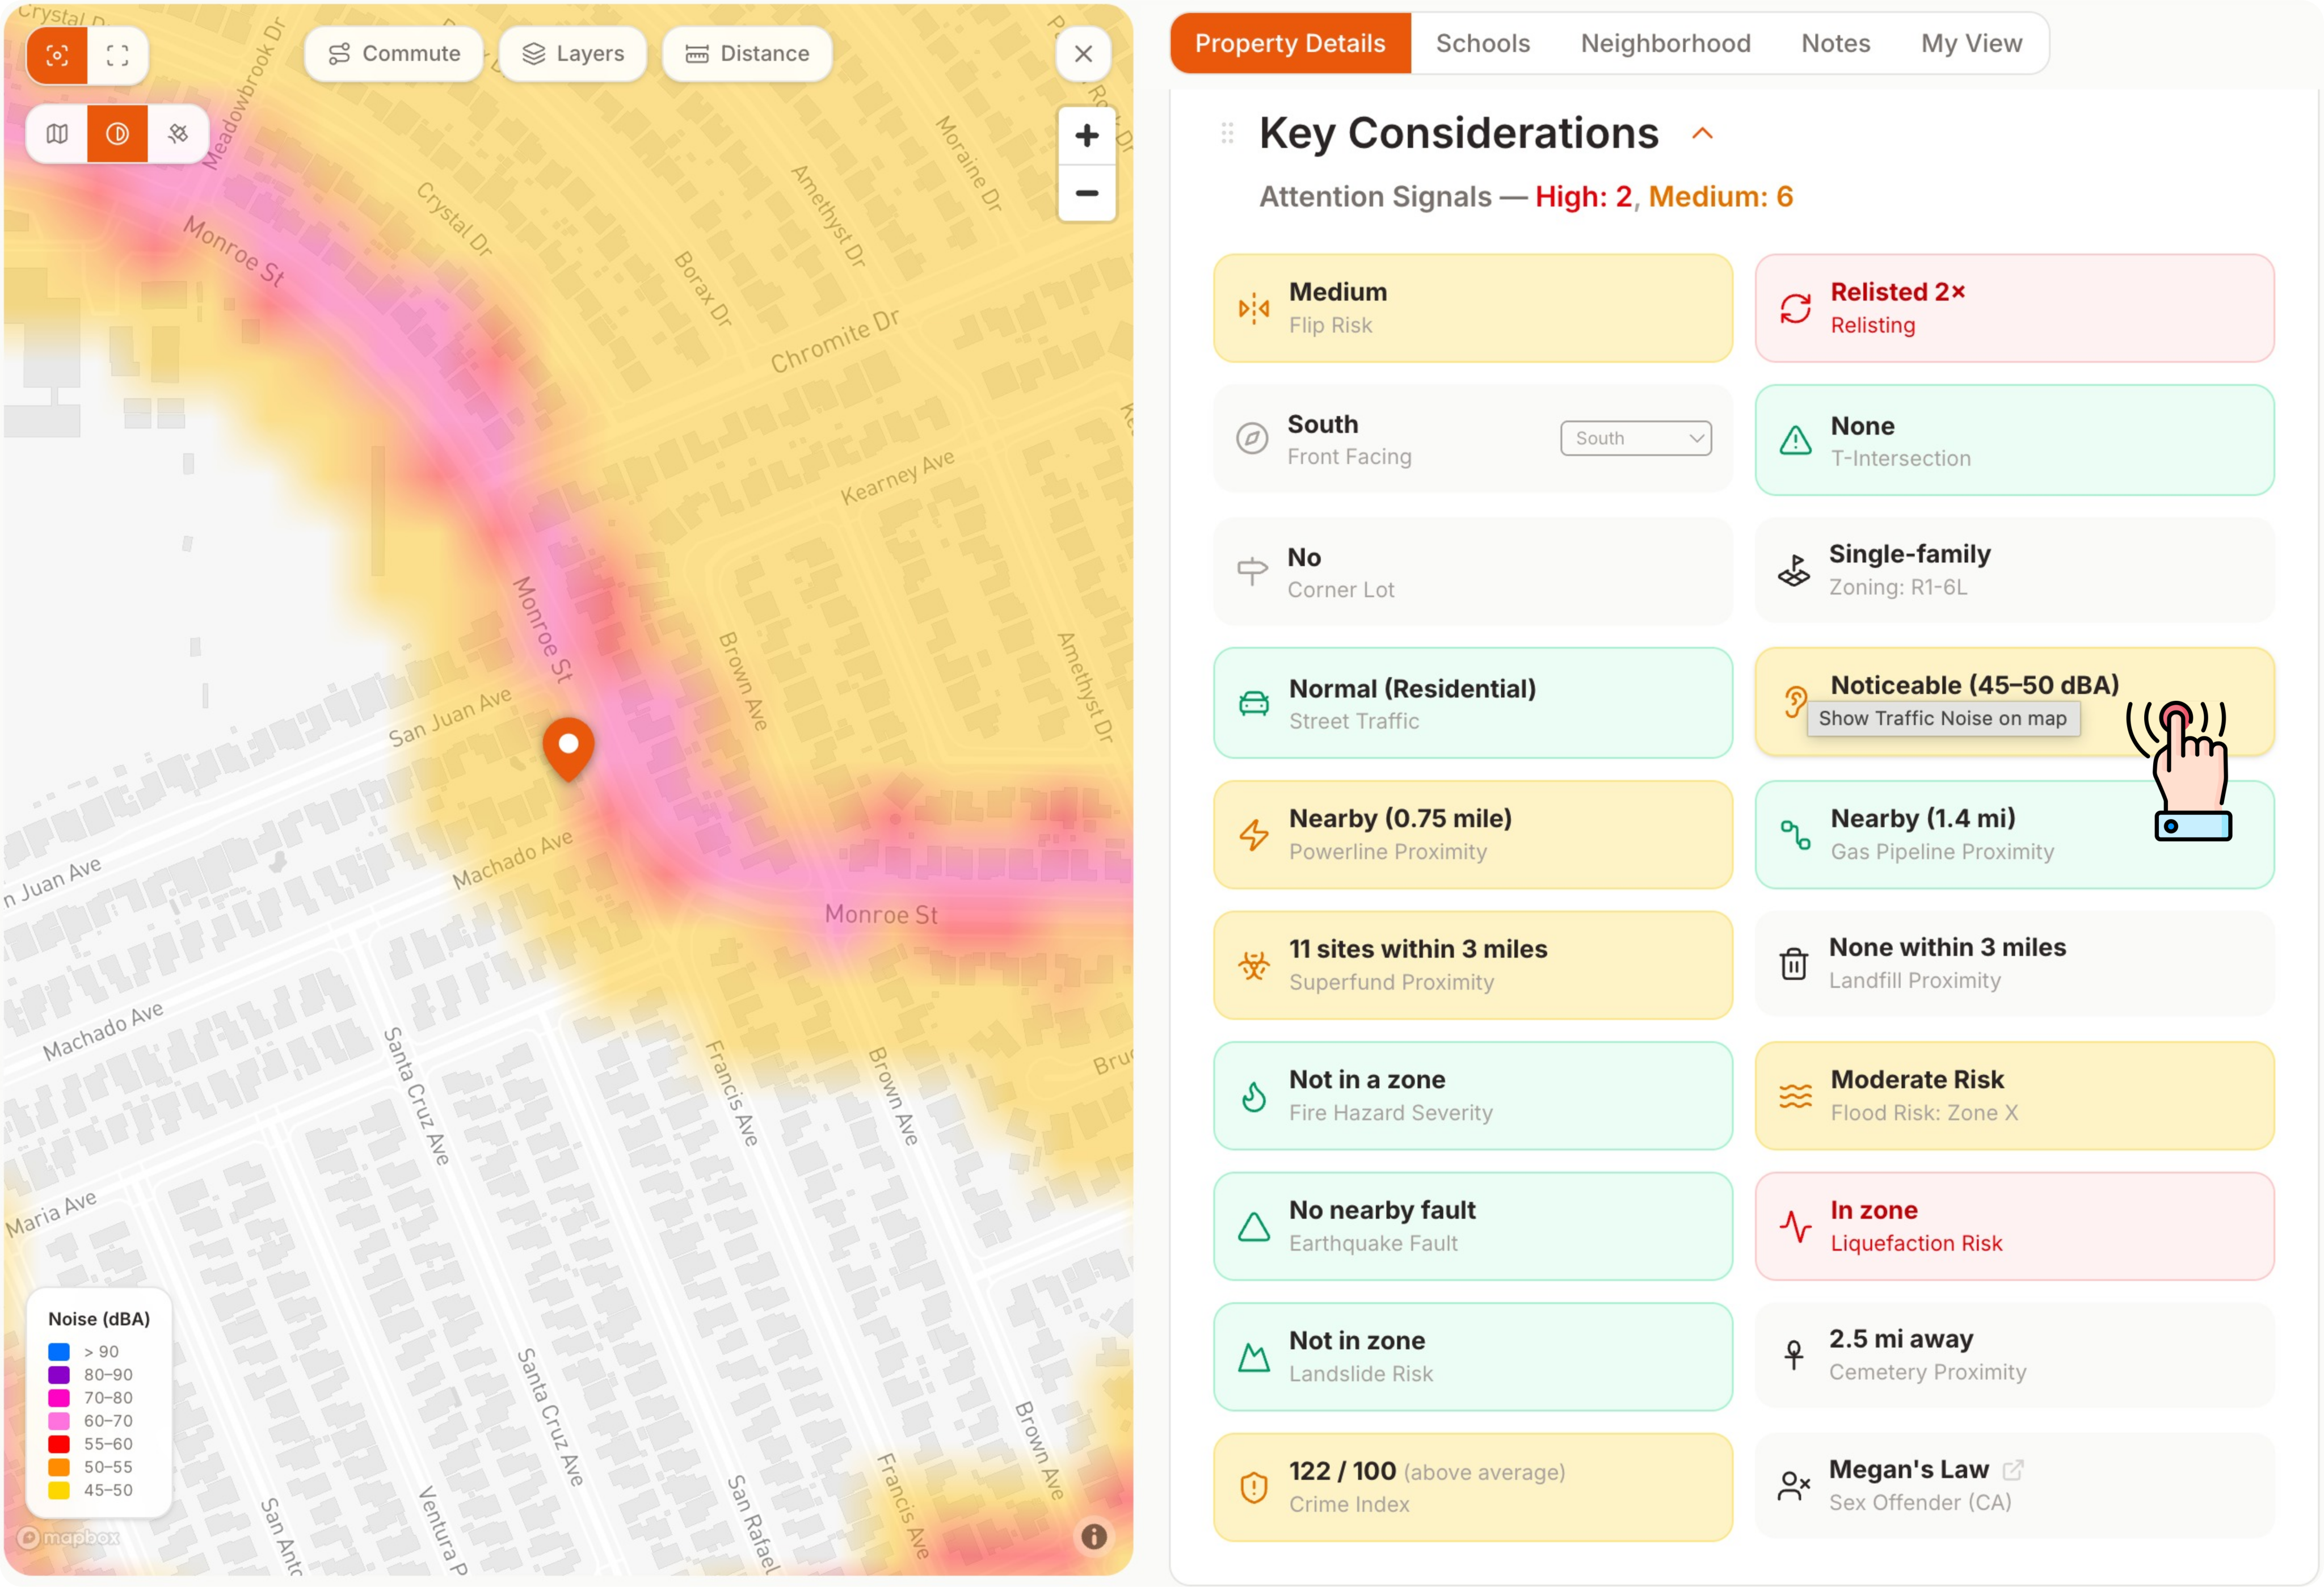
Tap a flagged Key Consideration card, and the map opens already zoomed in with that risk's overlay on.
Browse and switch
Prefer to explore on your own terms:
- From your Watch List, select the home you want to explore; the map centers on its pin. (On the Web App, click the map icon above your Watch List if you had previously hidden it.)
- Open the overlay controls: the Risk Overlay button on the left of the map on the Web App, or the Risk Overlay button among the map's controls on the Mobile App.
- Tap a risk, for example Flood. The zone draws around your pin, and a legend explains the colors.
That is the whole mechanic. Every risk overlay works the same way: turn it on, read the legend, turn it off.
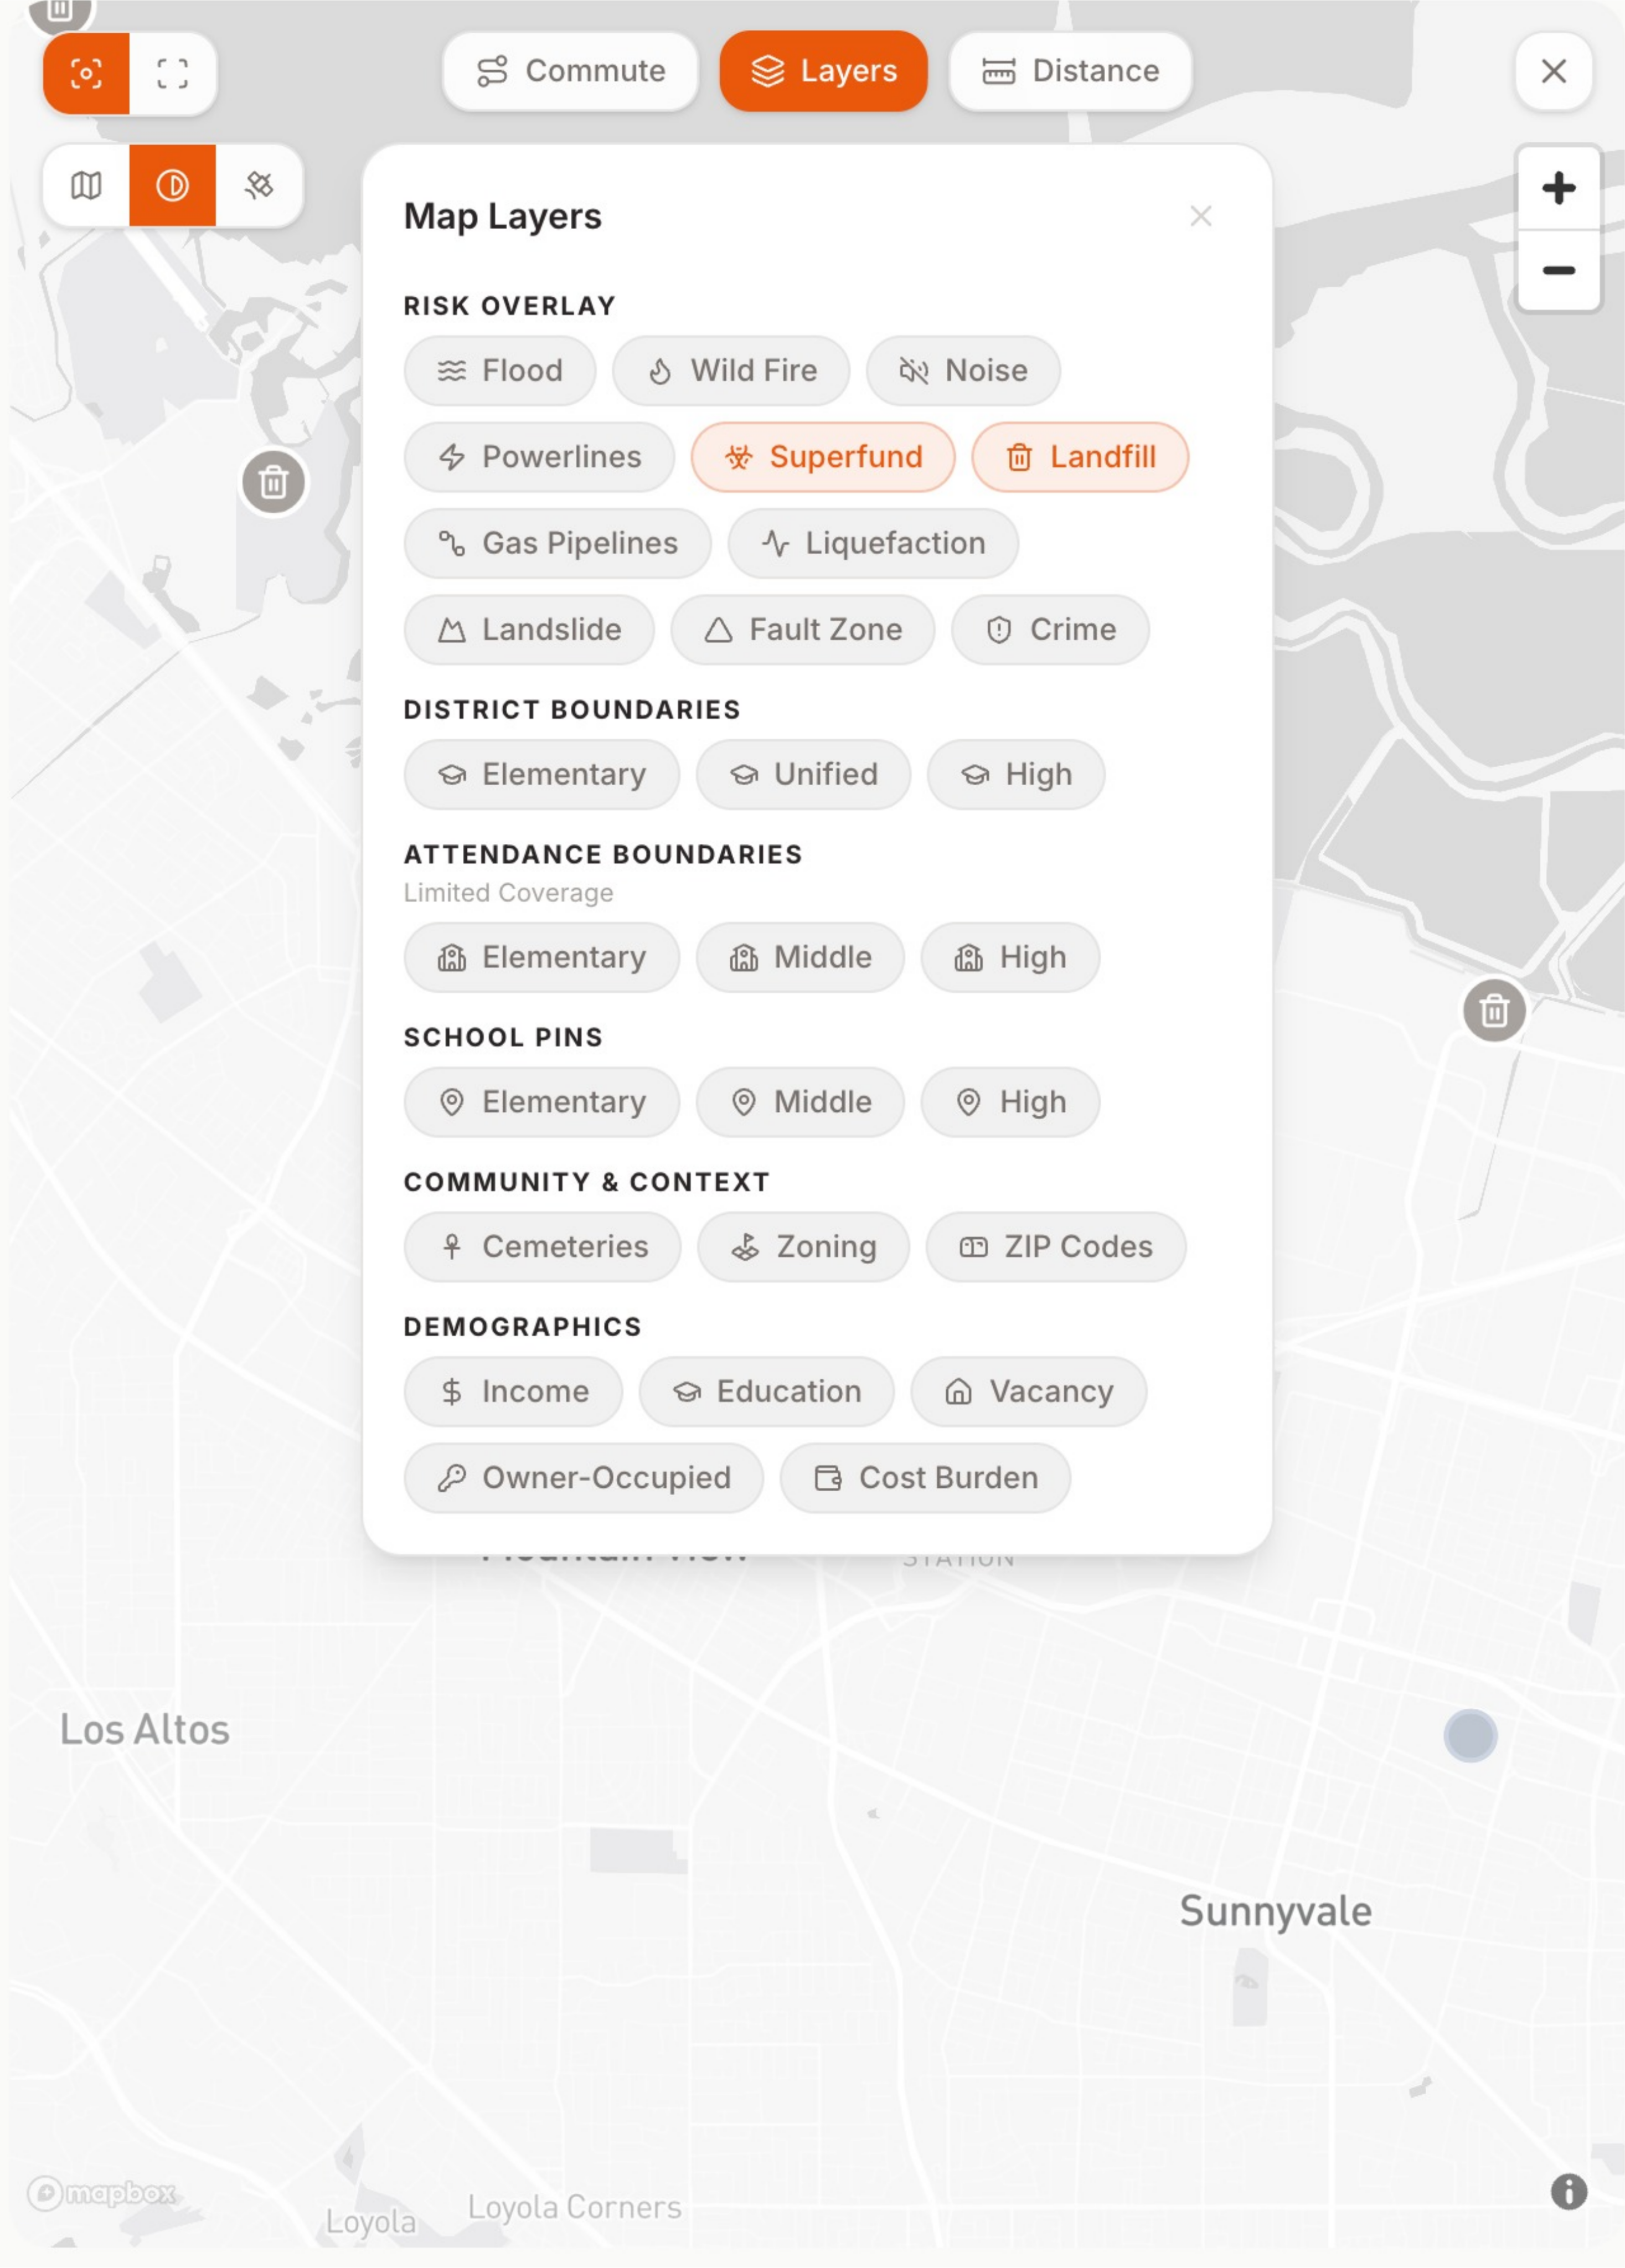
Open the overlay controls and tap a risk: the zone draws around your pin, with its legend.
Stack the risks that matter to you
Risk overlays compose. Turn on Flood, Fire, and Powerlines together and you are reading the neighborhood the way an inspector would: not one hazard at a time, but as a whole picture.
The risk group covers the hazards a listing never mentions: flood, fire hazard severity, noise, power lines, Superfund sites, landfills, gas pipelines, liquefaction and earthquake fault zones, landslide, and crime. Each linked risk has its own article in our Key Considerations section explaining what the zones actually mean.
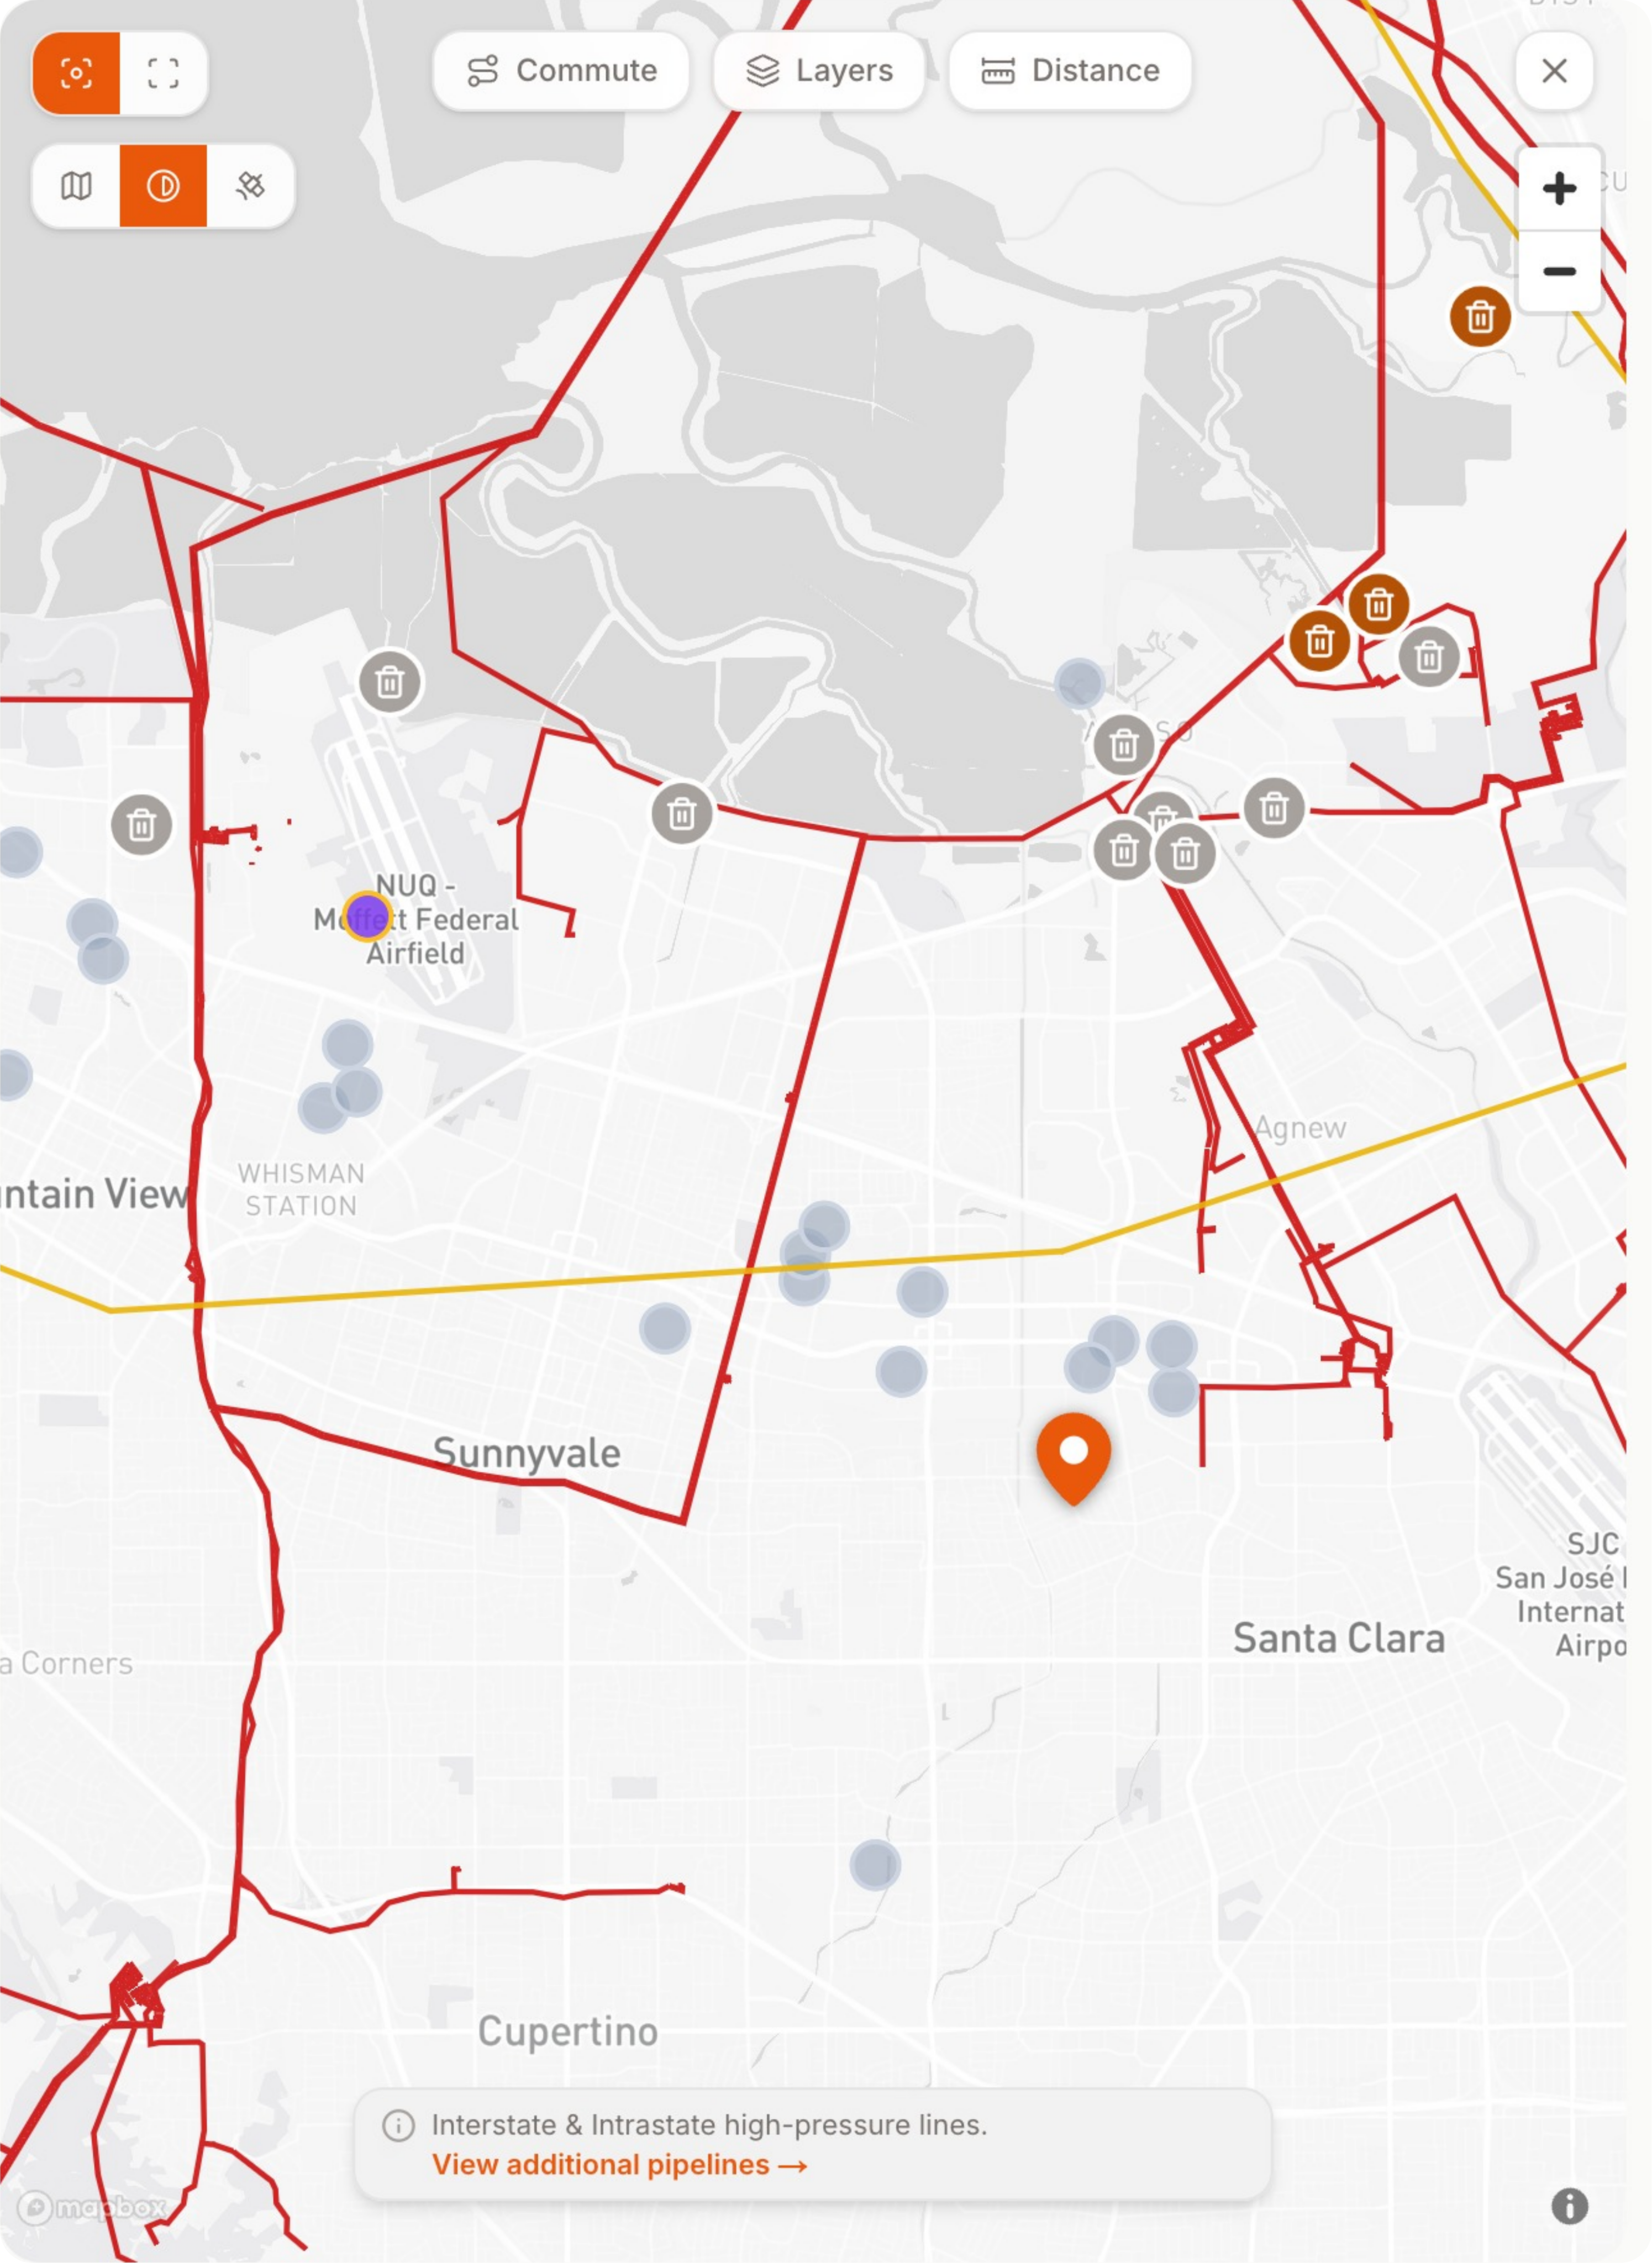
Two or three risks at once: the same neighborhood, read as a whole picture.
Measure it, don't guess it
"Near a landfill" and "1.8 miles from the landfill, upwind" are very different findings. Two tools on the map settle it:
- Radius rings draw distance circles around the home, a quarter mile and one mile by default, so you can see at a glance what falls inside each ring.
- The measure tool draws a line from the lot to anything on the map and gives you the real distance.
You can change the default rings and units (feet, yards, miles, or metric) in settings, and your presets apply on both platforms.
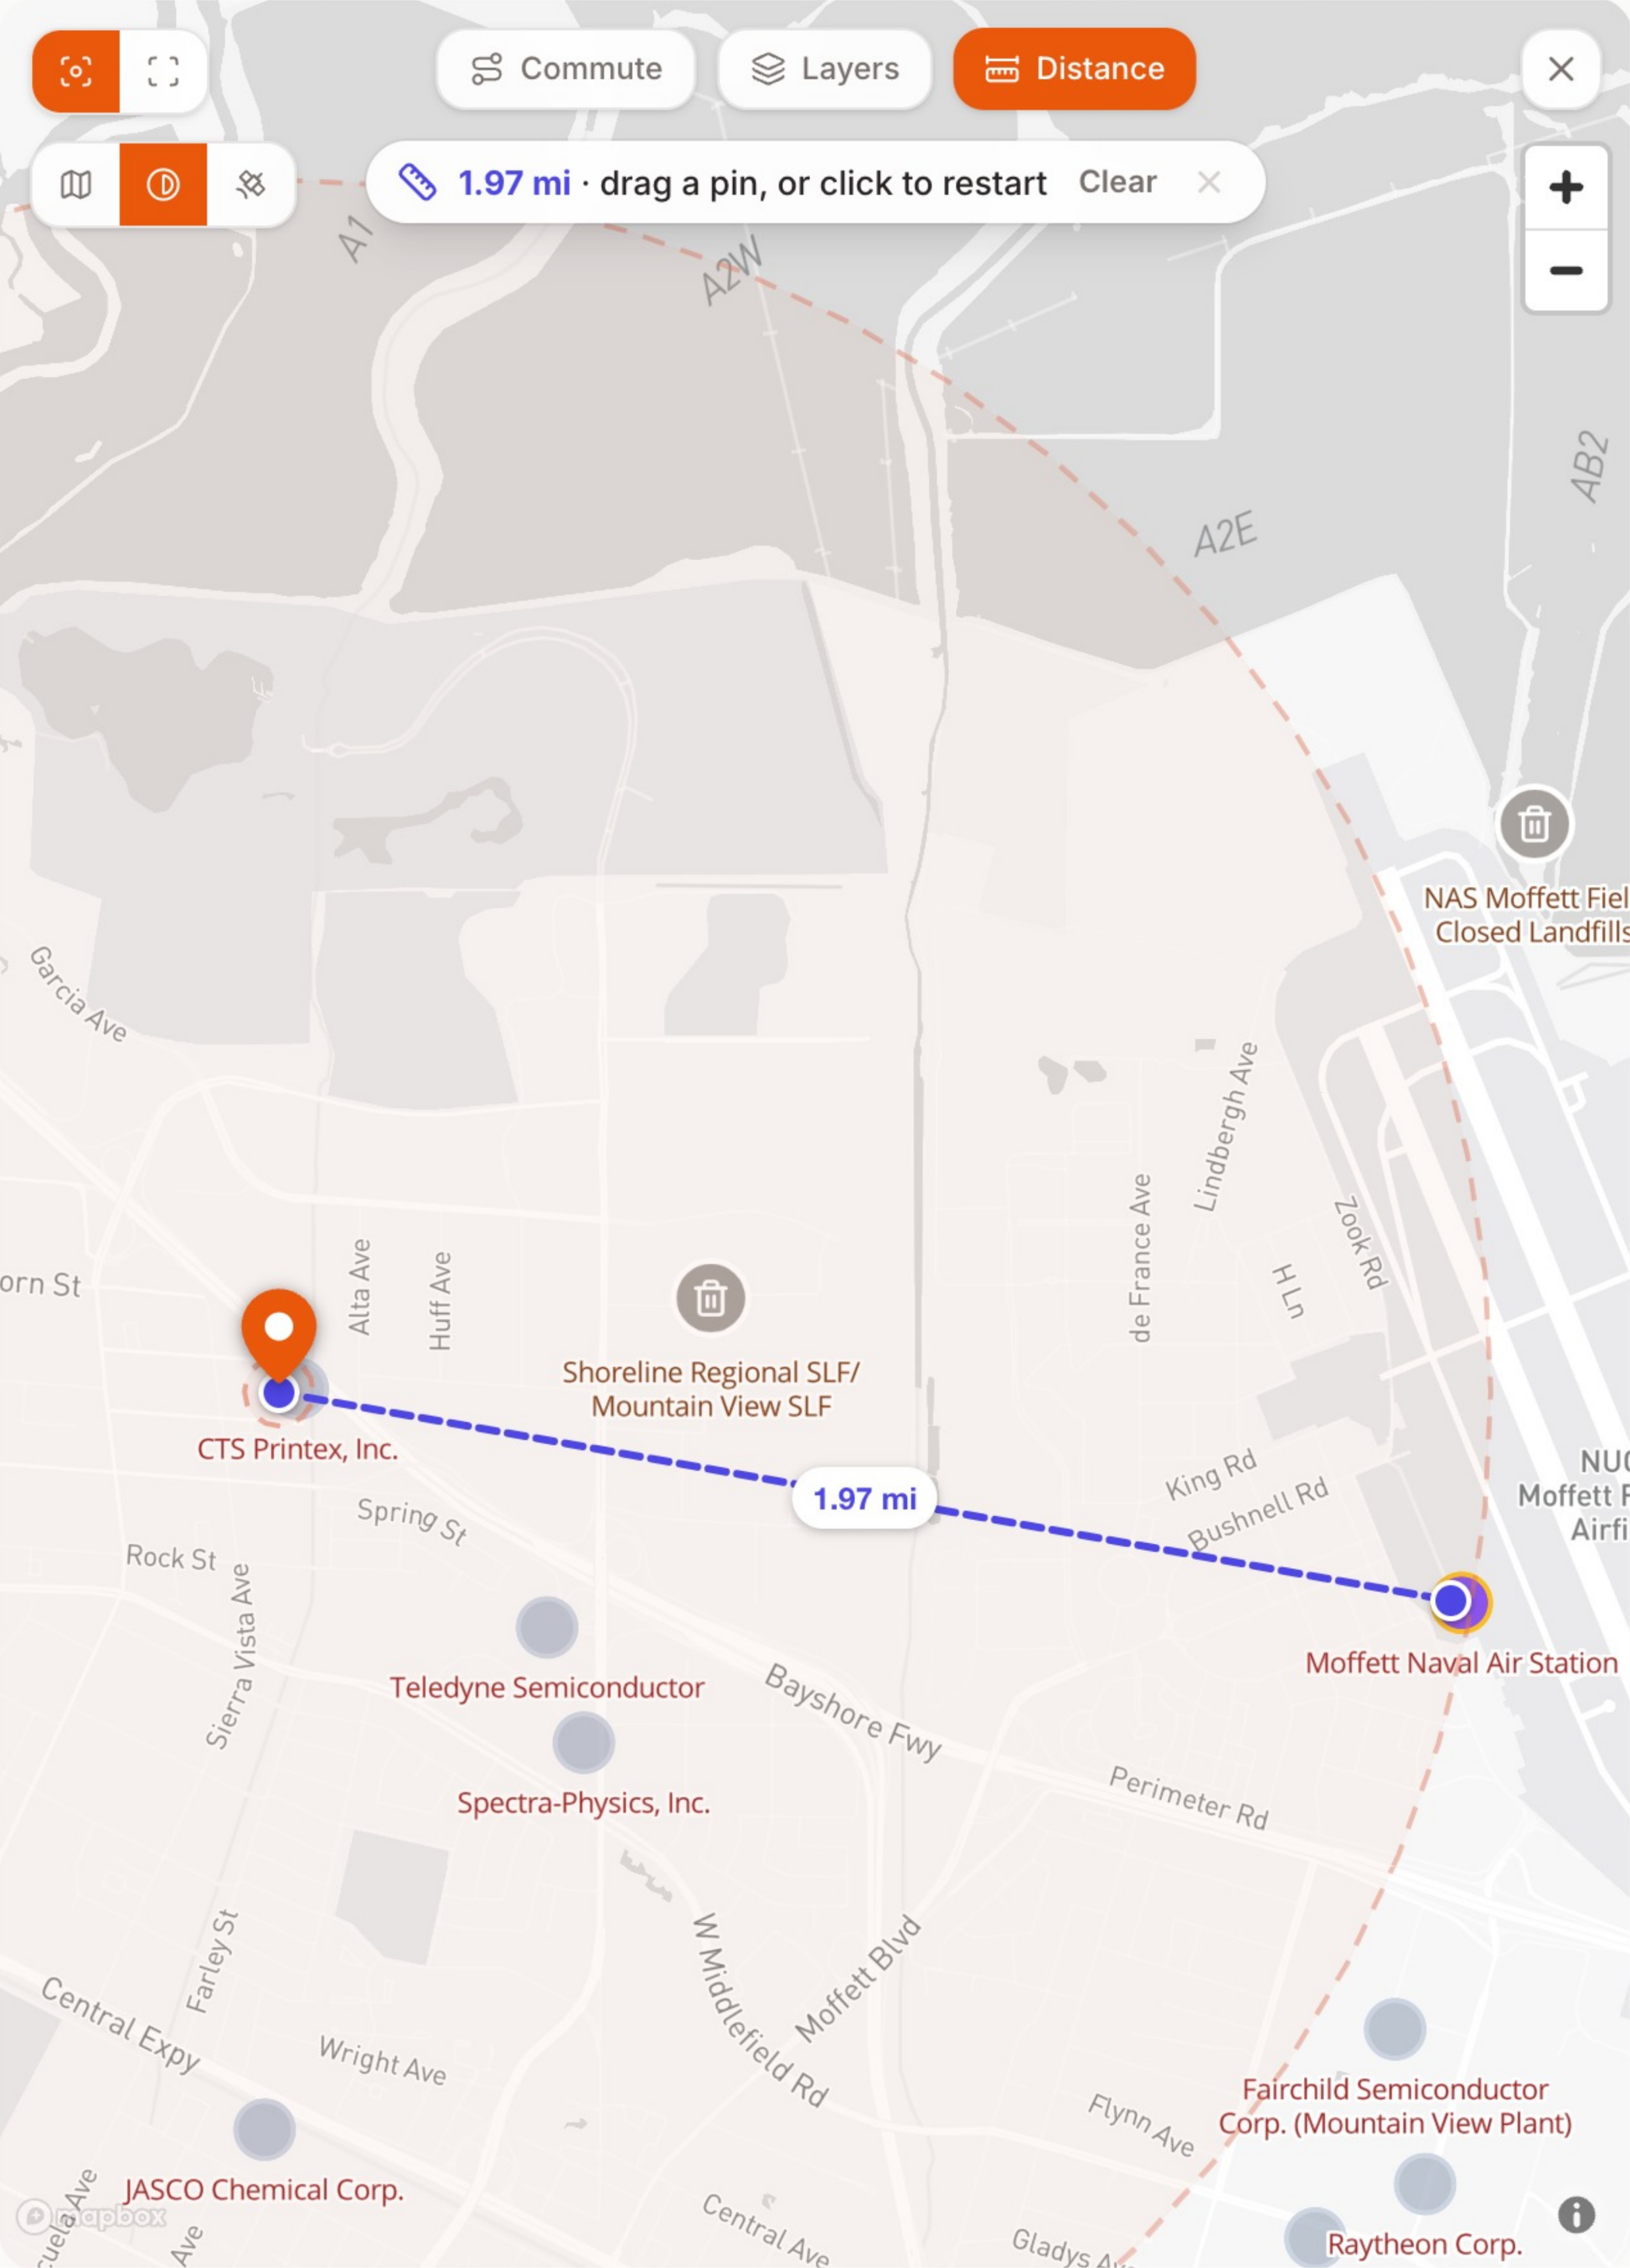
Radius rings and a measure line, so a distance is a number, not a guess.
Make the controls yours
Twenty-plus overlays is more than most buyers need every day. In Settings → Map Layers, hide the ones you never touch; the chip row shows only what you kept. Hide an overlay on your computer and it is hidden on your phone too.
Risk is one of three overlay groups on the map. Schools have their own dedicated walkthrough, and neighborhood demographics are covered in the Neighborhood section's own article.
Related how-tos
Updated Jul, 2026